

Regression — explained in simple terms!!
- Aishwarya V Srinivasan
- Sep 9, 2019
- 3 min read

In this article, I wish to put forth regression in as simple terms as possible so that you do not remember it as a statistical concept, rather as a more relatable experience.
Regression — as fancy as it sounds can be thought of as “relationship” between any two things. For example, imagine you stay on the ground and the temperature is 70°F. You start climbing a hill and as you climb, you realize that you are feeling colder and the temperature is dropping. When you reach the hilltop which is 500 meters above ground level and you measure the temperature is 60°F. We can conclude that the height above sea level influences temperature. Hence, there is a relationship between height and temperature. This is termed “regression” in statistics. The temperature depends on height and hence is the “dependent” variable, whereas height is the “independent” variable. There may be various factors influencing the temperature such as humidity, pressure, even air pollution levels etc. All such factors have a relationship with the temperature which can be written mathematically as an equation.
Formal Definition of Regression
Any equation, that is a function of the dependent variables by a set of weights is called a regression function.
y ~ f (x ; w) where “y” is the dependent variable (in the above example, temperature), “x” are the independent variables (humidity, pressure etc) and “w” are the weights of the equation (co-efficients of x terms).
For example, the equation can be
y = 0.5 x1 + 2.15 x2 + 0.76 x3
where 0.5, 2.15 and 0.76 are the weights of the equation. These weights are to be learned by studying the relationship between the dependent and independent variables.
How to determine the regression equation?
The question now is to figure out how to learn the weights of the equation. Why are we even doing this? Yes, we are doing this to make predictions going forward. Once we know the relationship between the dependent and the independent variables, we can predict the dependent variable beforehand. To learn the regression equation, we need to have some true data collected from the field. We humans, learn from real world experiences. Similarly, regression function can be learnt only by having an initial real data — termed as “training” data.
In the example considered, we need to record the temperature at different heights, pressure levels, humidity and all factors we know that influence our dependent variable. An example dataset would be the following.

Like the above table, we need to collect as much real data as possible. Let me denote “temperature” as “y” and rest of the features (height, pressure, humidity) as “x”. We define the error function as sum of (y-x*w)² . i.e., sum of squares of error for each data point. We need to find out the “w” vector that minimizes the above function (logically, not cause errors). When is the function mathematically minimum? It is where the slope of the equation is 0. Hence, we can find the “w” vector by equating the slope of the below function to 0 and solve for “w”.
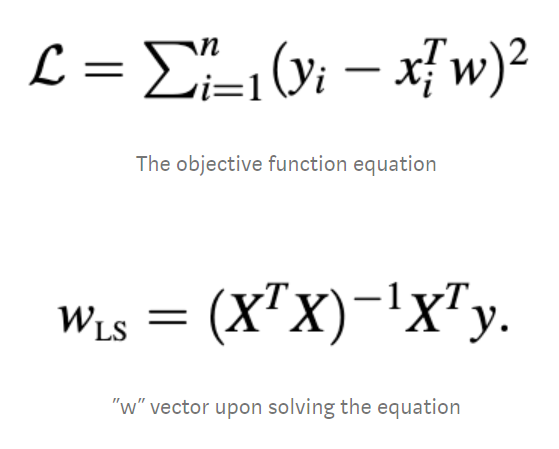
This article is not meant to go too much in to the math, however, the weight vector is obtained by the above equation. Using all data that we collected, we get the “w” vector by the above equation.
I hope this article was helpful to you. Please leave your queries if any below.


Comments